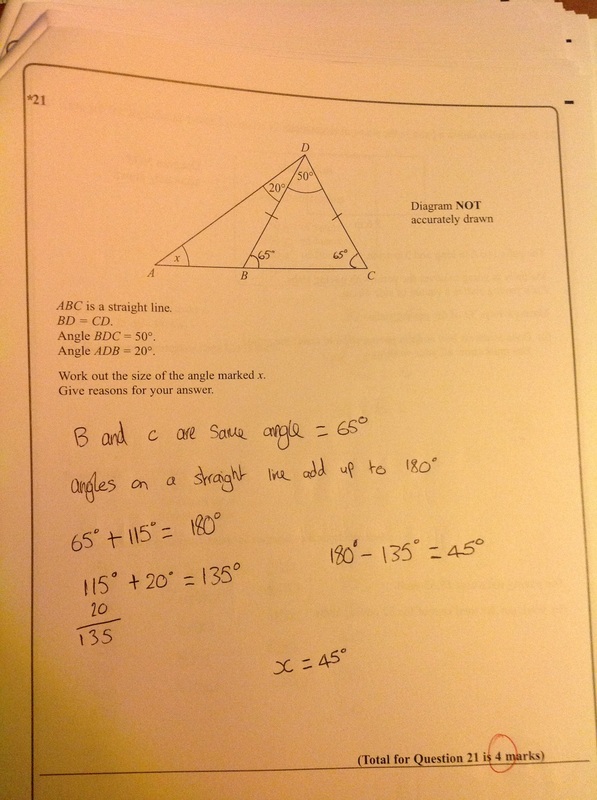
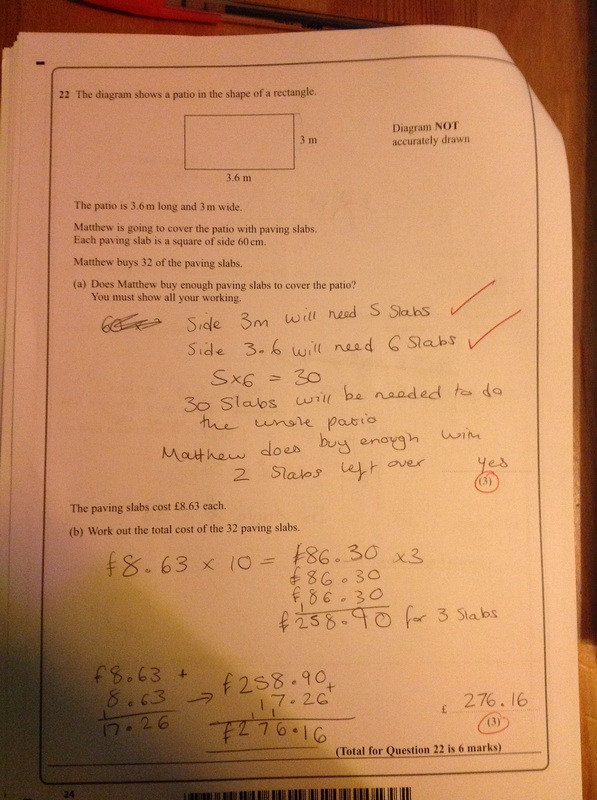
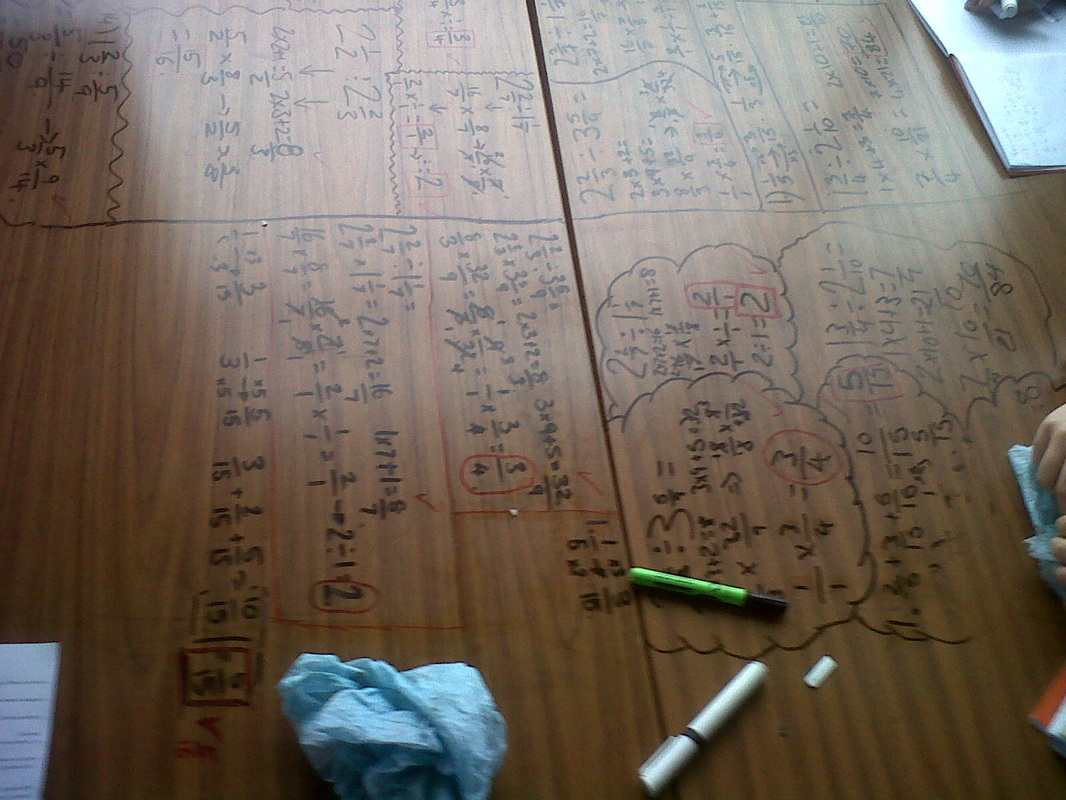
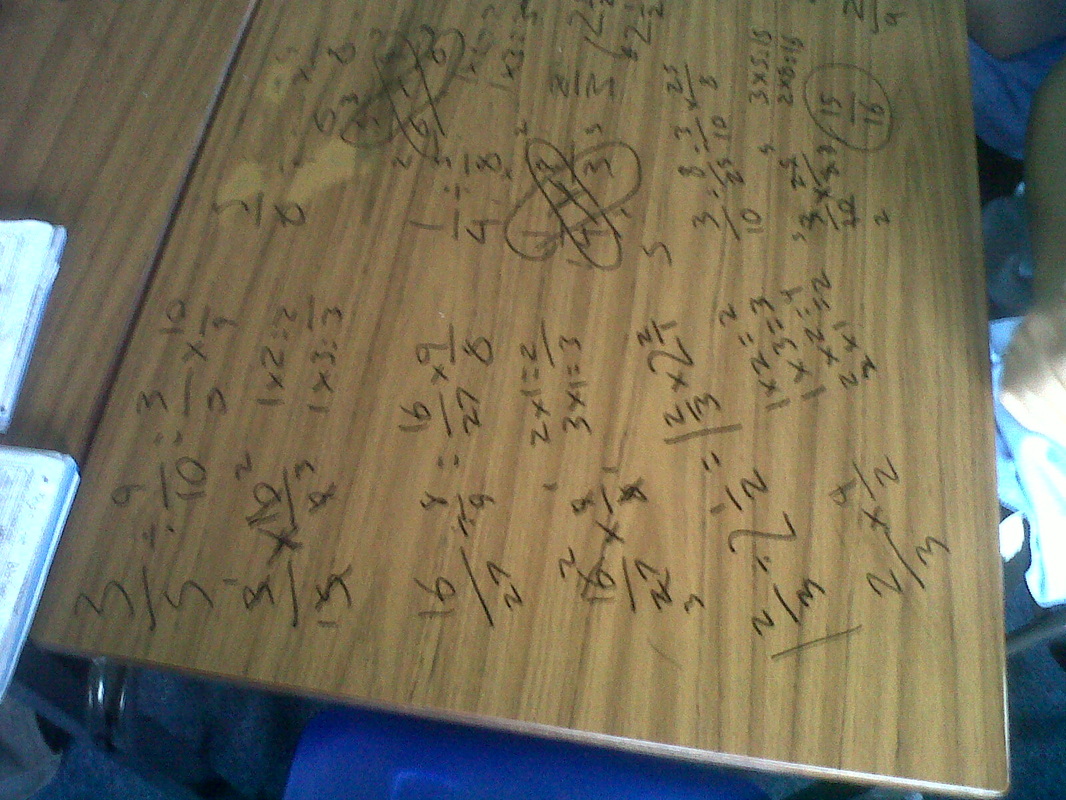
To allow pupils time to review mock papers at home, using their own work as feedback we have posted a 'best example' exam paper on our class blog. A photo of every question - using the best answers from within the class - it gives pupils an opportunity to mark their work against that of their peers. I have included two of the pages as an example, we use the entire paper on our blog.
0 Comments
A few stick on scabs and fake blood. A willing member of SLT and 'super 8' style video clips and year 7 have got to save the world. The original work (and more) can be found here http://motivate.maths.org/content/MathsHealth/
The levels I have put on this chart may be slightly out, I haven't had time to fully check them. The half term task has come from the Wiki as we try to move to the pupils directing the learning. For this lesson each table will have a toy car and be asked to make a box. There will be no help offered by me, we will have all the resources they need available. I will photograph work, put it on the Wiki and we will discuss strategies and work together to make nets (presuming they work this out). From there we will go on to how much card we have used and into surface area (this has been a topic raised on the wiki already). Pupils should have photo's ready for this lesson (from homework - find a photo that raises a question) which we will use to direct our learning this half term.
The clue is in the title and it is amazing the amount of extra work and discussion you can generate by doing away with everything except a board pen and a desk.
This is bits if other peoples work stuck together, the powerpoint is not mine – I only refer to it to demonstrate the alternate angle theorem. The initial task will use the number loving sheet to review where pupils are right now. The following steps are relatively self-explanatory. We will return to the number loving sheet at the end where pupils should be able to review their learning and complete new questions.
Dotty averages was an excellent lesson, pupils are really taking control of the learning, when they returned with their sorted data some had simply put it in order, others had done graphs and some had worked out averages. This meant they introduced the key words, we wrote them on the board then groups tried to work out what they meant - the class were given 5 minutes with the instruction 'if no-one on your table knows then go and find someone that does - you must know the answer in 5 minutes'. I told them nothing and they all could tell me the about the mean, median, mode and range - they ironed out their own misconceptions and corrected their own thinking. They then worked out the mean, median, mode and range of our data. I added in my guess of 2500 and we reworked our range and averages to see the effect - this led to us agreeing to use the median rather than the mean. To introduce stem and leaf we discussed the pro's and cons of their own tables, then I asked someone to read out the data and completed a stem and leaf on the board as the data was read out - pupils were then asked to explain how it worked, they could easily work this out from watching me complete it but they all followed much easier than when I have taken the time to explain what I am doing. We redid the dots experiment (by which point they were desperate for the answer), then we compared our answers using the range and median. Finally they were given the result - our second guess was closer and with a lower range. Pupils were able to demonstrate a good understanding of both terms (beyond it's the biggest take the smallest) 'How big is a cow' is to cement the work on stem and leaf and to get some levelled work in the books (peer assessed). To do 'how big is a cow' I show the class a normal cloth and ask them to write down how many cloths it would take to go from head to the back end of a cow. We record the data in a stem and leaf, discuss and then take 2 volunteers to be the head and bum and we measure out our cow. Every time I've done this the cow is usually too big to fit in the room. Boys V Girls on staring competition, record the data on a 2 way stem and leaf, compare boys results against girls, complete a written summary and peer assess.
Pupils responded really well to the task, asked lots of interesting questions. We decided to split them into questions that we would need to research to find the answer and those we thought we could work out ourselves.
The key question pupils chose to follow was how high was the chair/ how high is the table. Pupils worked out their own answers in groups with no help. They put together a short answer on a post it and 'posted it' under their question. One group asked to do a different question so they put it on an A3 sheet - stuck it up and followed their own thread. We then compared answers and more importantly methods. From this the pupils themselves discovered that we could estimate using the relative heights of people in the picture, we discussed average heights and off they went again, reviewing their work and improving their answers. The starter activity ended up taking most of the lesson, we covered metric and imperial conversions, implications of imperial units and decimal calculations, estimating, rounding, averages and reveiwing and improving our work. All the information was drawn out of the pupils and driven by them. There was a brilliant moment when someone put an answer on one of the questions we had discarded as needing research as she had an answer for it. This allowed us to talk about independent enquiry and was the first 'in' for getting the pupils to take over their own learning. Feedback was extremely positive. We did get onto the dots. Pupils made their guesses, we had time to write down the 'long list' of answers and the homework set was "sort out the data for next lesson". This really frustrated them because I haven't told them how to do it. I was open about this - I told them I was deliberately not helping them but that they couldn't get it wrong - I want to see how they sort the data. That is our starting point for tomorrows lesson. |